Apr 27, 2016 · 4 min read
10 Of the Best Infographics In Marketing This Past Year
Infographics are hot and there’s no sign of them losing popularity anytime soon.
If you make the right infographic you can get thousands of shares, links and plenty of traffic.
Here are 10 of the best infographics, based on total shares as reporting in BuzzSumpo, from the last 12 months. Congrats to all the companies who created these!

 This is a great visual breakdown of which colors and feelings are connected in the human mind and how that works with branding and logos.
 This infographic breaks down basic rookie mistakes in social media marketing and explains what makes these mistakes so problematic.
 This infographic focuses on how video marketing impacts lead generation, brand awareness, and online engagement.
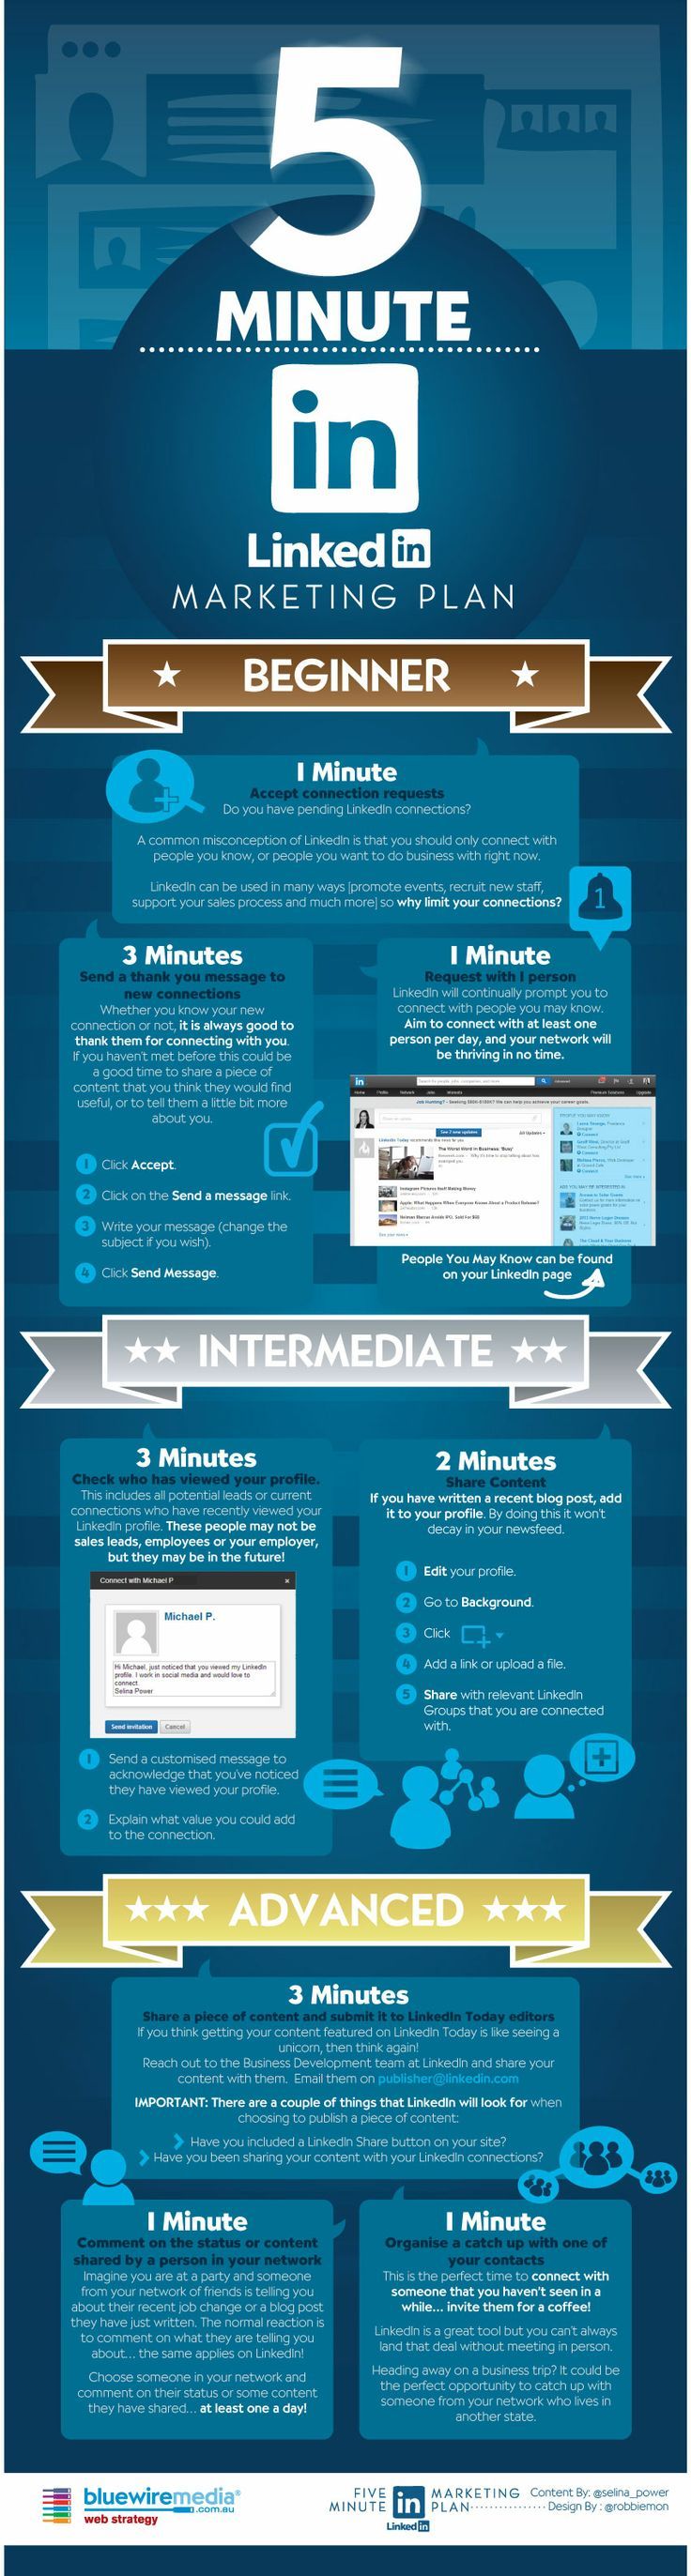 This graphic details a simple, actionable plan for growing your LinkedIn following in five minutes a day.
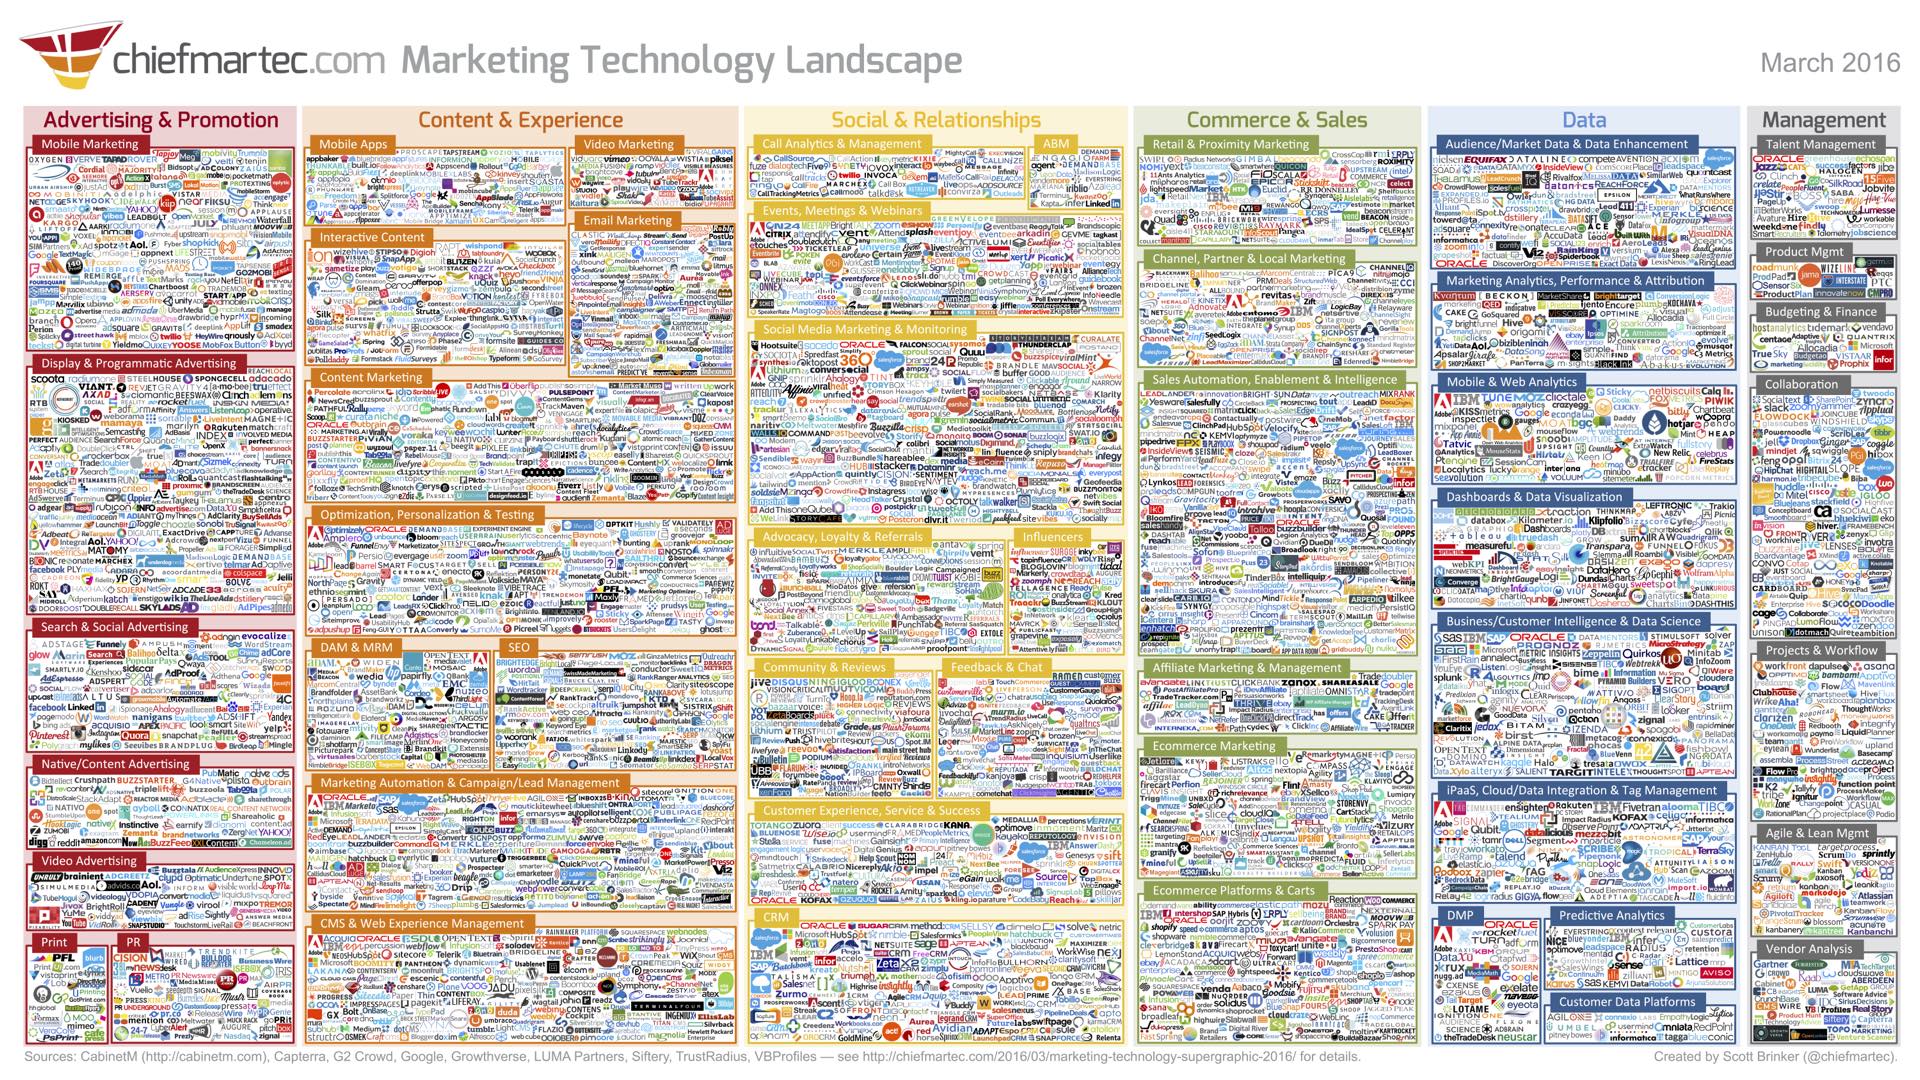 This extremely detailed infographic details and itemizes almost 4,000 companies which are now part of the marketing technology landscape.
 This infographic provides 21 inbound marketing strategies for accelerating business growth and moving customers through your sales funnel.
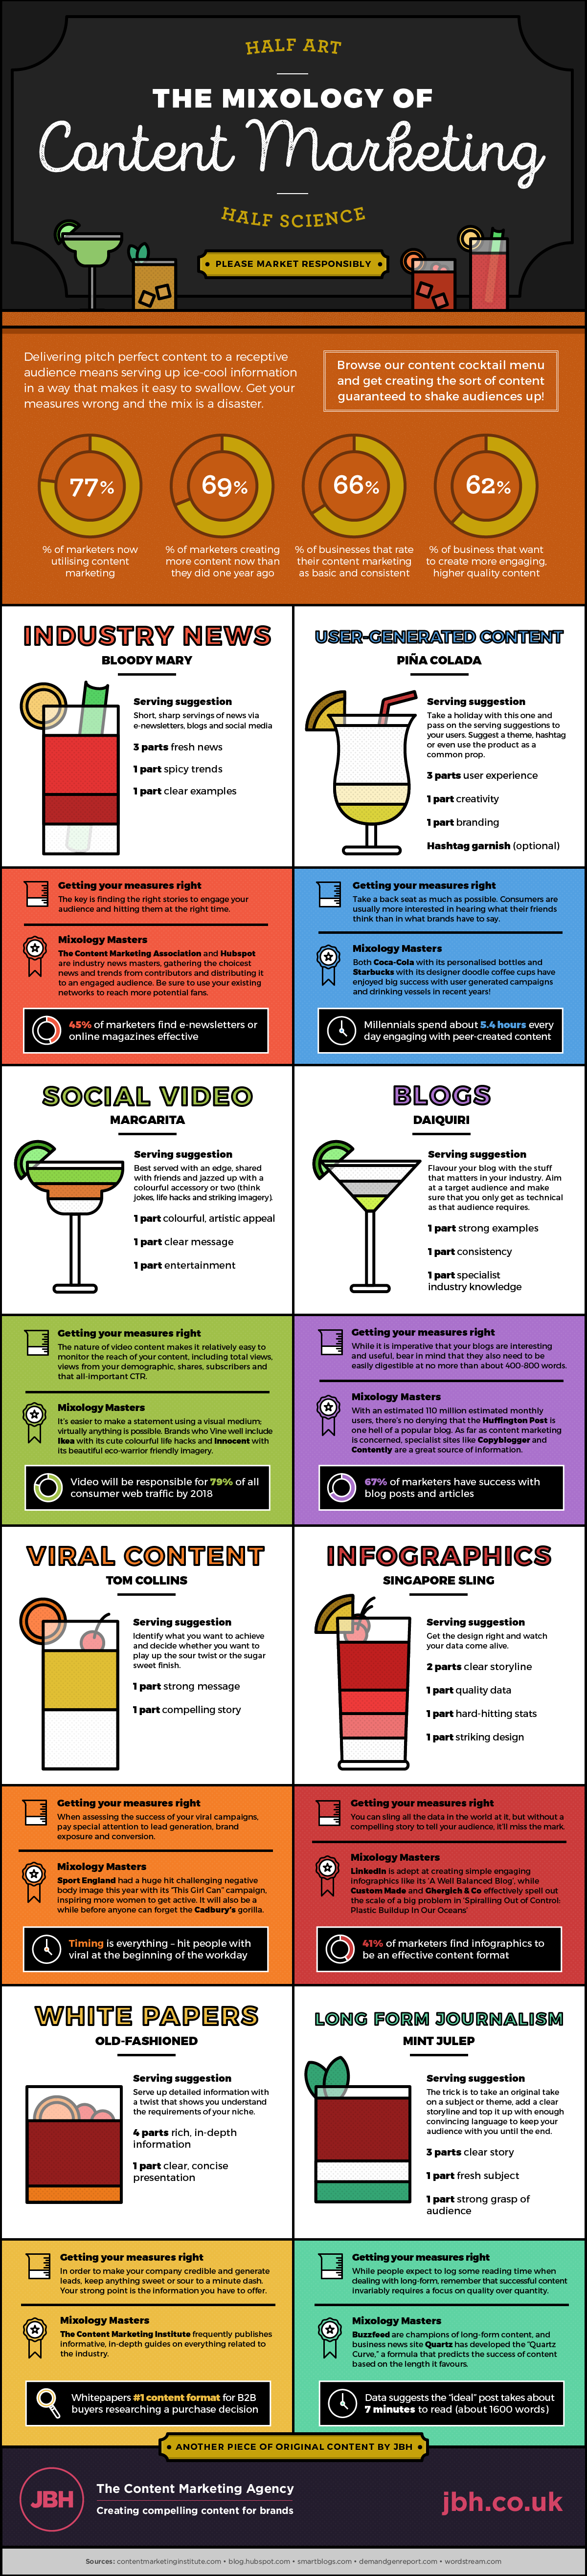 This fun infographic approaches content marketing as mixology, a delicate balance of getting the right mix of content to your audience; the images and text provide that balance as a set of how-tos.
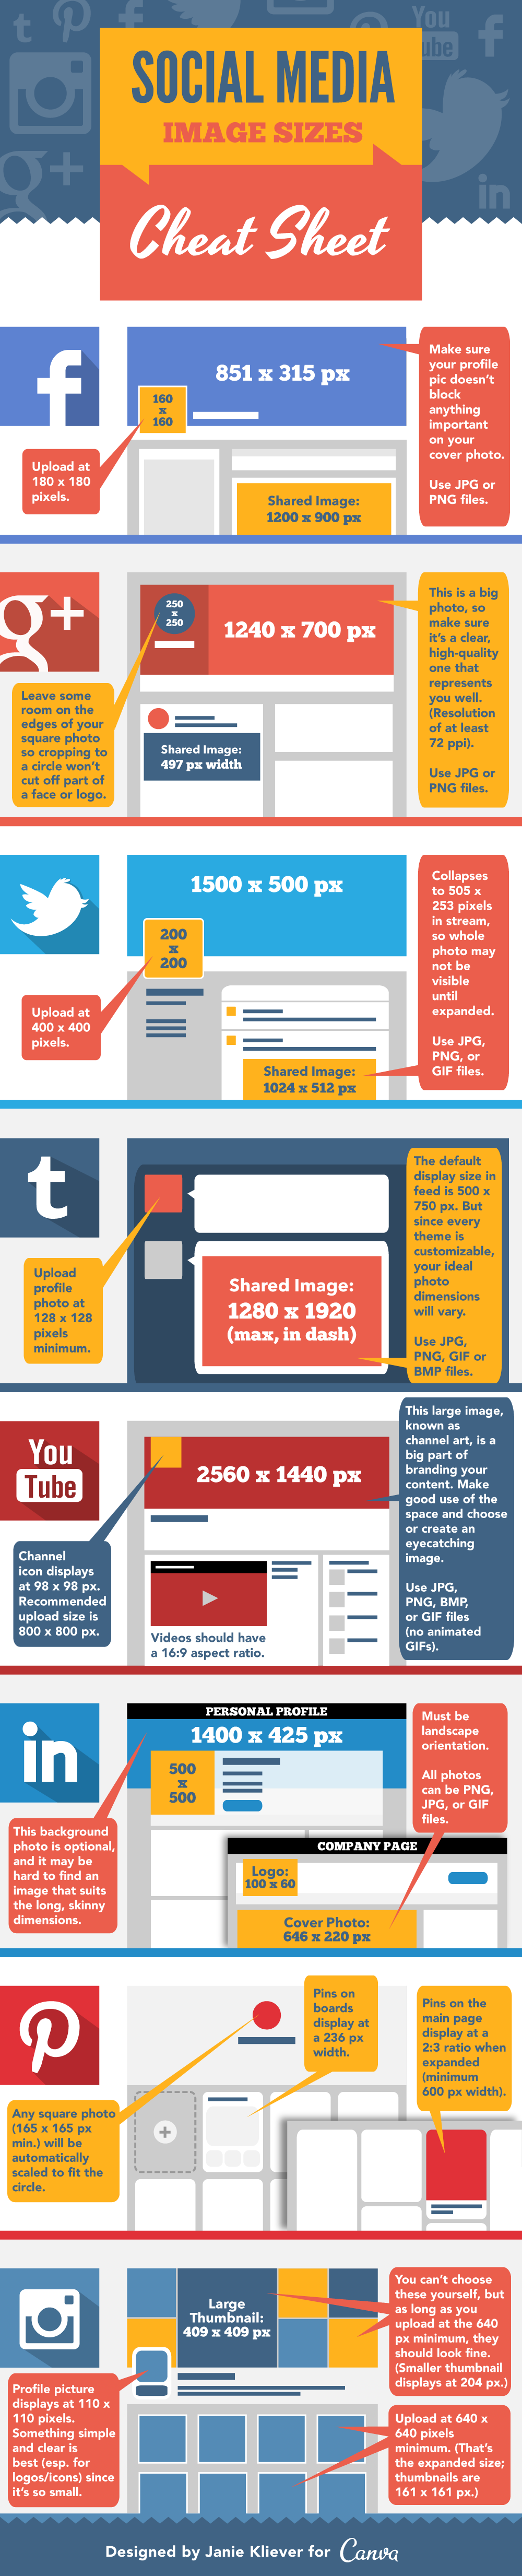 We all already know that social media posts with images are far more successful; use this infographic as a cheat sheet for creating perfectly sized and optimized social media images.
 This infographic is another great “cheat sheet” resource which includes all of the best times for posting on all of the major social media platforms for optimal performance.
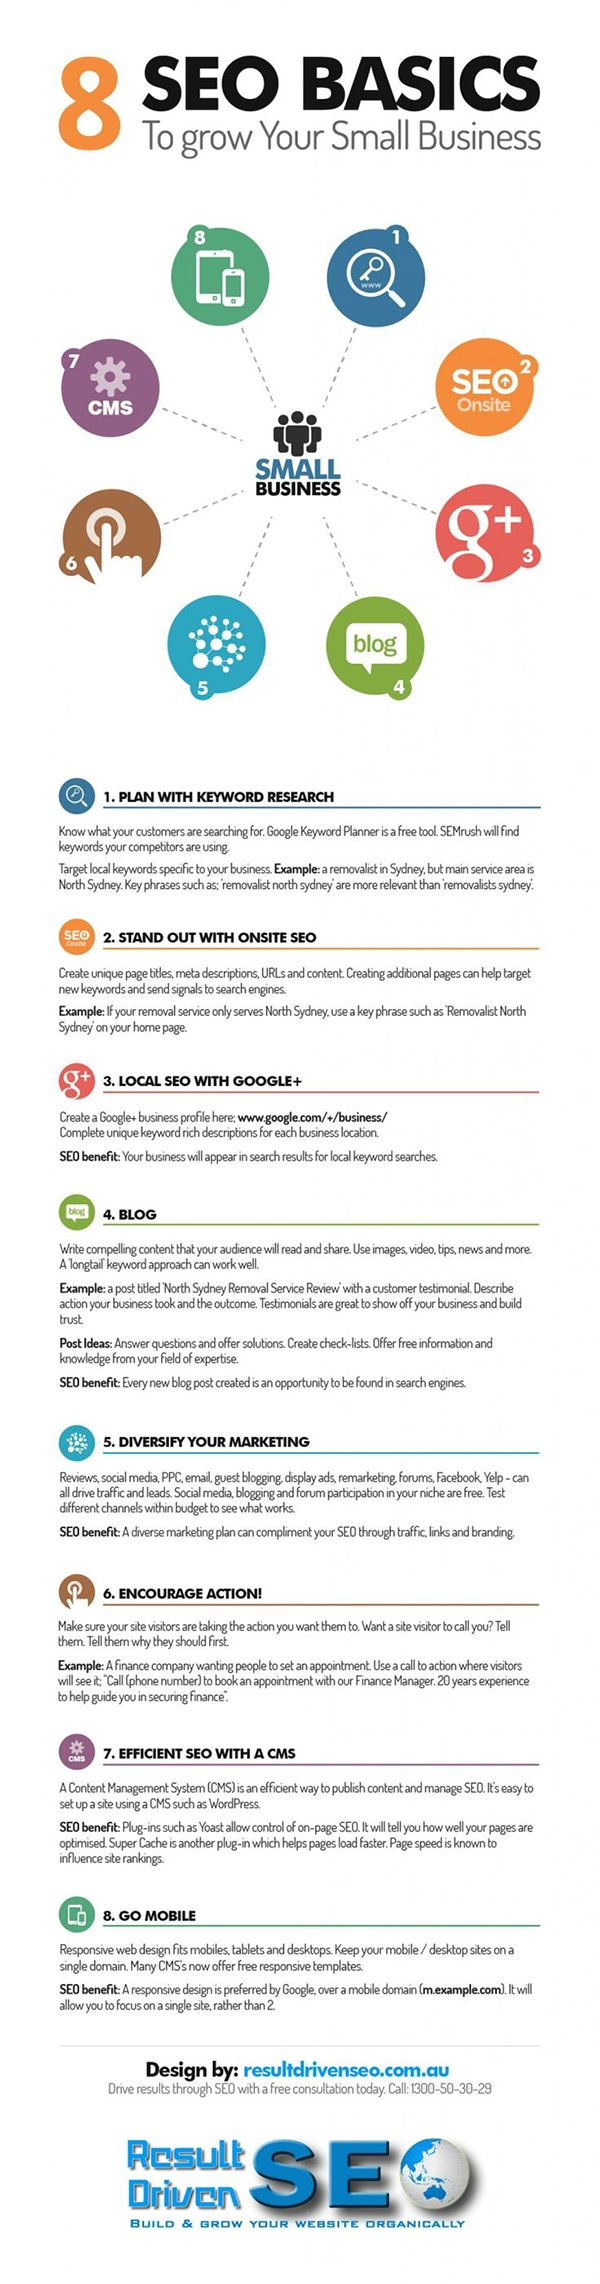 This infographic focuses on basic steps small businesses should take right now to improve their SEO enough to allow for noticeably better growth.
Which infographics did you find the most useful this past year? I’d love to see the ones you used the most in the comments.
10 Of the Best Infographics In Marketing This Past Year
What the Color of Your Logo Says About Your Company – Colourfast
This is a great visual breakdown of which colors and feelings are connected in the human mind and how that works with branding and logos.
8 Social Media Marketing Mistakes to Avoid – Digital Marketing Philippines
This infographic breaks down basic rookie mistakes in social media marketing and explains what makes these mistakes so problematic.
25 Video Marketing Statistics for 2015 – HighQ
This infographic focuses on how video marketing impacts lead generation, brand awareness, and online engagement.
5 Minute LinkedIn Marketing Plan – Bluewire Media
This graphic details a simple, actionable plan for growing your LinkedIn following in five minutes a day.
The 2016 Marketing Technology Landscape – Martech
This extremely detailed infographic details and itemizes almost 4,000 companies which are now part of the marketing technology landscape.
21 Essential Strategies for Growing Your Business With Inbound Marketing – Eliv8group
This infographic provides 21 inbound marketing strategies for accelerating business growth and moving customers through your sales funnel.
The Mixology of Content Marketing – JBH
This fun infographic approaches content marketing as mixology, a delicate balance of getting the right mix of content to your audience; the images and text provide that balance as a set of how-tos.
The Complete Social Media Image Size Guide: With Awesome Design Tips – Janie Kliever for Canva
We all already know that social media posts with images are far more successful; use this infographic as a cheat sheet for creating perfectly sized and optimized social media images.
What Are the Best Times to Post on Social Media? – Quicksprout
This infographic is another great “cheat sheet” resource which includes all of the best times for posting on all of the major social media platforms for optimal performance.
8 SEO Basics to Grow Your Small Business – Result Driven SEO
This infographic focuses on basic steps small businesses should take right now to improve their SEO enough to allow for noticeably better growth.
Which infographics did you find the most useful this past year? I’d love to see the ones you used the most in the comments.